ESM 263 Geographic Information Systems
Assignment 1 - Cartography
CONTENTS
Due at Fri 2023-01-20 23:59
Summary
- Learn basic principles of cartography and map design.
- Do the tutorial exercises to learn the basics of QGIS.
- Design and construct a map using provided data.
- Submit your assignment to course website.
Grading
This assignment is worth 10 points (10% of your grade), awarded according to the scoring rubric. Your map should adhere to design principles, contain all appropriate design elements, and present data accurately.
Tasks
Task 1: Principles of cartography and map design
Creating maps is one of the most common applications of GIS. A well-designed map is a powerful communication tool, but it takes practice and experience to master. You do not need any spatial analysis techniques for this assignment, but you do need to understand the core concepts and design principles behind mapmaking (i.e., cartography). We will discuss these principles in lecture and lab, and we’ve posted some readings on the course website. Read the article from O’Looney, and focus on key principles—such as map layers, map elements, visual variables, symbology, and commonly used map types such as choropleth.
Task 2: Tutorials
You will learn the basics of QGIS to navigate and create maps via hands-on tutorials in the Bolstad book.
- Read the excerpt from textbook Chapter 4, “Output: Hardcopy Maps, Digital Data, and Metadata”.
-
On your own, work through “Lab 1: introduction to QGIS” from the textbook:
- Read the following subsections of section 15.1.3 of the QGIS manual on Features Rendering:
- Work through QGIS training manual 3.3.3 - 3.3.4
Task 3: Design a map
Design a map of the world that shows demographic information for each country.
Bonus:
1) Instead of using the provided dataset, you can find another dataset of your choice on the web and use it instead. Don’t forget to reference the source!
2) Calculate ratios of the metrics, e.g. the population density.
-
Create a folder for your HW1 project, called, e.g.
HW1/ -
Download the assignment data file
HW1.zip. This data was extracted from The CIA World Factbook (Extraction script) - Extract
HW1.zipinto your HW1 project folder. It should contain:world.gpkg. A geopackage containing the outlines of the countries of the worlds and various metrics on these countriescapitals.gpkg. A geopackage containing the capitals of the world.bbox.gpkg. A geopackage containing a bounding box of the world and 20 degree graticules.
-
Start up QGIS and save the new empty project as
ESM263/HW1/HW1.qgzThe Browser panel will now contain a Project Home “folder” that serves as shortcut to
ESM263/HW1 -
Add
world.gpkgto your map either by drag and dropping or by using Layer→Add Layer.Pro tip: You could also just double-click on
world.gpkgin the Browser panel. Doing this for anything that QGIS knows how to display will add it to your map as the top layer(s). -
Optionally, add
capitals.gpgkto your map. Decide if you want to display the capitals or not. -
Take a look at the different metrics displayed at on the CIA World Factbook Guide to Country Comparisons page. This contains the metadata for the world.gpkg data. Skim the different metrics and their descriptions.
-
Choose a metric to use for your map from the variables documented in the metadata. Examples include Area, Population. You may choose any variable (or calculate ratios of different variables). Use the Attribute Table of the world layer to view the data in tabular form.
Here is an example map with Title, Legend, and Acknowledgement elements:
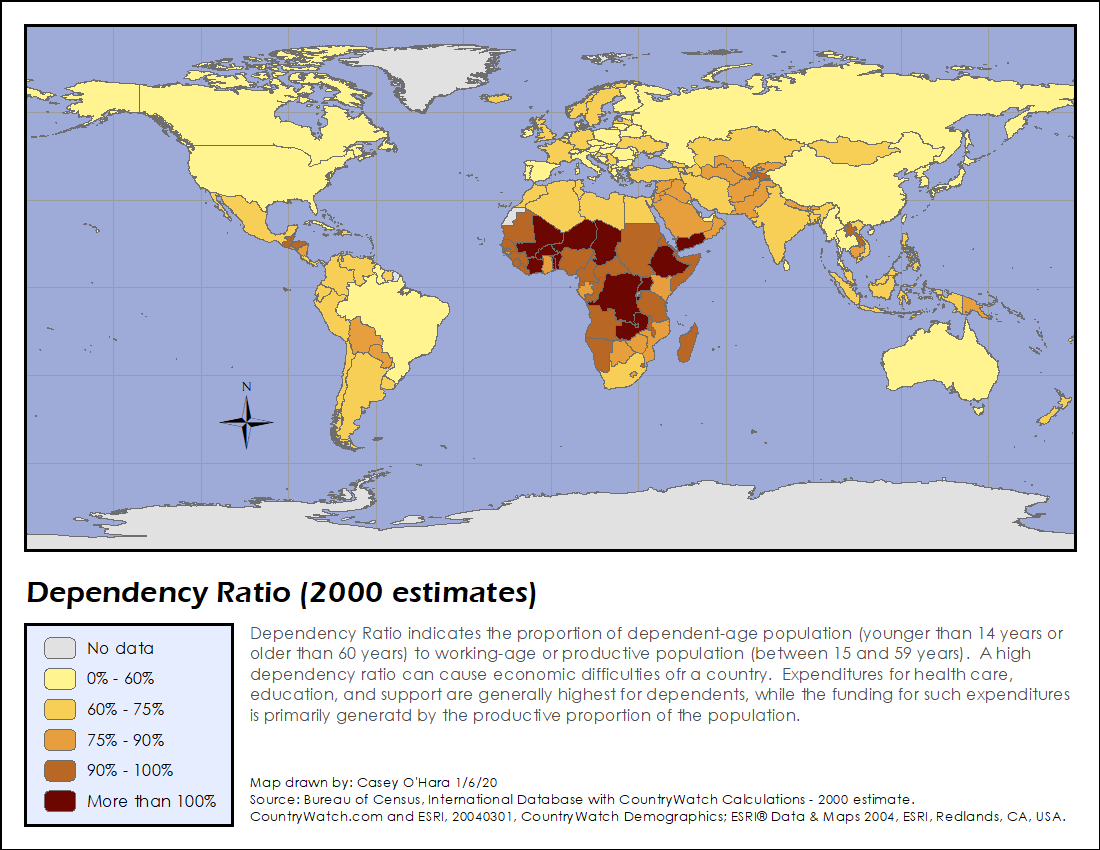
-
Design a map for your data, while considering these questions:
-
What is/are the source(s) for your data?
-
What are the units of your variable?
-
If your variable has a value of
-99, what does that mean? -
How will you describe your data in supporting map elements, such as a legend?
-
What is an appropriate symbology to communicate your data visually?
You might want to consult subsection 15.1.3.1.4. Graduated Renderer of the QGIS manual.
-
-
Lay out your map using the Layout tool (Project→New Print Layout). Include Title, Legend, and Acknowledgment elements. Remember to include your name and your data sources. For your page layout, use letter paper in landscape mode (11" × 8.5").
Export your map as a PDF image by using Layout→Export as PDF (or click the Export as PDF button) and use
HW1.PDFas the file name.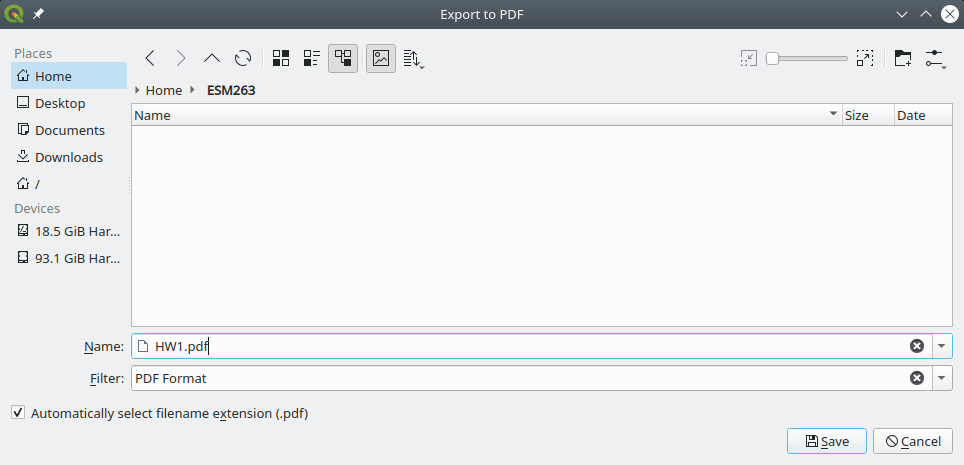
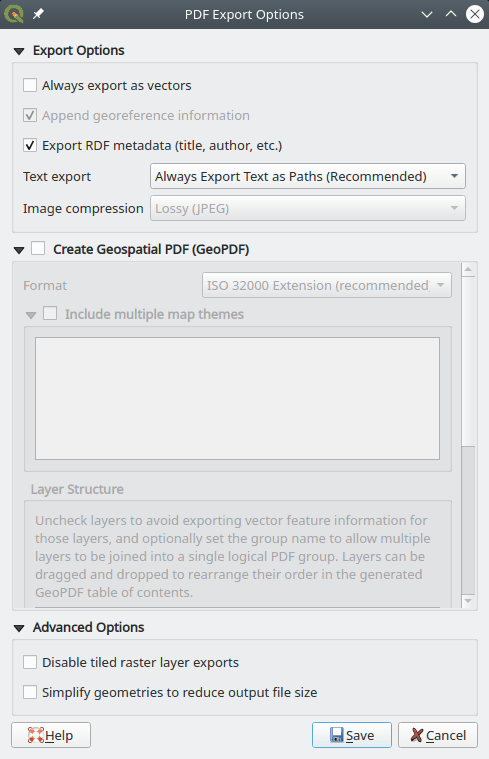
Un-check Simplify geometries to reduce output file size:
- Verify that your PDF document contains a clear and readable map.
Task 4: Turn-in your assignment
- Rename your map image file to include your full name with proper capitalization and no spaces or punctuation (Camel Case; e.g., from
HW1.pdftoHW1MortimerSnerd.pdf. - Create a submission by uploading your map image file to the assignment page on the Canvas course website.
Things to look out for
Design and layout
- "No data" symbology should be distinct (and subdued).
- When converting to quantile scale, your units change to rankings.
- Use sequential or divergent color ramps for intervals.
- Check out ColorBrewer in QGIS.
- Limit unused layout space—zoom your data and arrange your elements accordingly.
Data sources and accuracy
- All information on your map should be self-consistent.
- Assume (for this course) that your audience is technical and that your map is going into a technical report, so err on the side of more detail than less.
- Incorrect or missing units—be precise, and adjust your units as needed.
- Lack of citation detail—be precise, and answer who, what, and when?
- Lack of attention to detail—poor or terse descriptions, typos, and spelling errors (QGIS does not have a spell checker)
Submission
- Follow the instructions closely for submitting your assignment, and name your files accordingly.